Air Lab Console
Get to know Air Lab Console, our web-based interface, allowing you to access data and configure your Air Lab.
Connecting
- Open Air Lab Console on a Chromium-based browser (Chrome, Edge, etc.).
- Click Connect and pair your Air Lab with Studio.
After a few seconds of loading the device's data, your Air Lab's data will be available to view. To indicate the connection, the Bluetooth icon will appear in the top-left corner of the Air Lab status bar. The sidebar also shows live status for your Air Lab—its power and battery state, internal and external storage, Wi-Fi/MQTT connectivity, and the installed firmware version.
Task: Use Air Lab Console to give your Air Lab a personalized name.
Data Access
The Live Data page displays graphs of the data collected by your Air Lab on an ongoing basis. Hover over a graph with the mouse to read individual values.
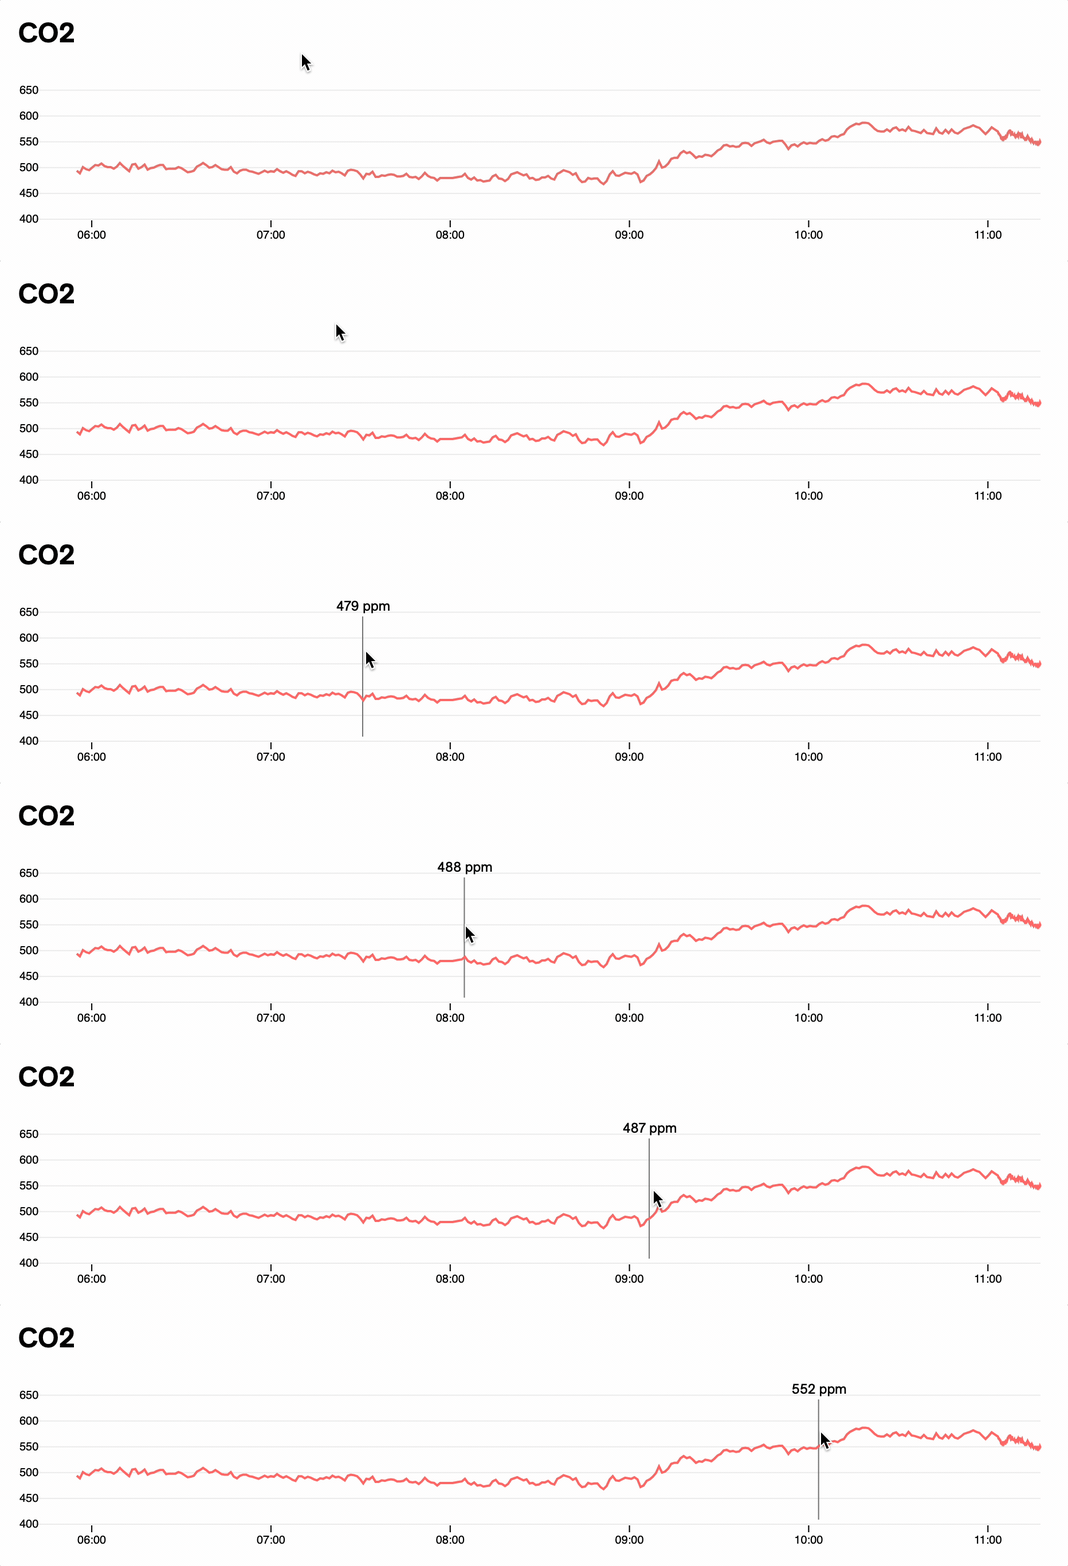
This view is particularly useful for displaying all graphs simultaneously, making it easier to spot correlations between air parameters and to see how specific events, such as opening a window, affect the environment across all graphs.
Similarly, you can analyze past measurements stored on the device in the Measurements program. Both the Live Data and Measurements pages offer a Download CSV button to save the data to your computer for further analysis.
Note: Timestamps in the Live Data and Measurements views are shown in the Time Zone configured on your device. If no time zone is set, they are shown in UTC—set one in Settings to see local times. Air Lab Console displays a banner whenever the device's time zone differs from your computer's. All data is stored in UTC internally.
Idle Screen
Note: This feature requires firmware v0.10.0 or later. If your device is running an older version, update it first via Firmware Update.
The Idle Screen section lets you manage the screens shown on your Air Lab's display when it's not actively used. You can add screens from a curated gallery, reorder them, configure their appearance, and enable automatic cycling.
Adding Screens
- Navigate to the Idle Screen section in Air Lab Console.
- Click Add Screen to open the install page.
- Browse the available screens in the Gallery and click Add Screen next to the one you'd like to install. The plugin will be downloaded and installed on your device automatically.
The same screen can be added multiple times with different configurations. You can also add screens from manually installed plugins. These will appear in the Custom section at the top of the install page.
Configuring Screens
Each screen can be individually configured. Click the Configure button next to a screen to open its settings. The available options depend on the screen plugin and may include toggles, sliders, dropdowns, and text fields. Click Save to apply your changes or Remove to delete the screen.
To reorder screens, drag them into the desired position in the list. Click a screen to set it as the currently active one.
Auto Cycle
Click the Settings button at the top of the Idle Screen section to access global settings. Enable Auto Cycle to have your Air Lab automatically rotate through all configured screens while idle.
Plugins
The Plugins page lists the plugins currently installed on your Air Lab. Each entry offers a Configure button to adjust its options and an Uninstall button to remove it from the device. Plugins are installed through Script Editor or added as idle screens from the gallery.
Settings
Under the settings page, you can give your Air Lab a personalized name, switch the interface language, and change the sampling rate of the measurements. Toggling Developer Menu in the Advanced section will make a new Debug page appear in the sidebar. This will also add the Developer program to your Air Lab.
Tip: To learn more, see Developer Mode.
For a full list of the available settings, see Device Settings.
Debugging
The Debug page gives you a detailed look at your Air Lab's internals. The Params and Metrics sections list the device's current values—type in the filter box to narrow the list, and click any value to copy it. The Files section lists the measurement files stored on the device, and Sensor shows how many samples are currently buffered.
At the top of the page, the Diagnostics group offers a few tools:
- Device Log opens a live stream of your Air Lab's log messages, each tagged with a timestamp. Toggle Auto-Scroll to follow new lines as they arrive, or click Clear to empty the view.
- Download Coredump retrieves a crash dump from the device, if one is available, and offers to delete it afterward.
- Remote Control lets you drive your Air Lab from your keyboard, using the arrow keys along with A (Enter) and B (Escape).
The Recording group captures your Air Lab's screen as a sequence of frames:
- Record (.png) and Record (.bin) capture readable images or raw frames. Recording starts immediately and exports one frame with each change in the screen; confirm the Stop recording? prompt to finish, and the frames download as a
record.ziparchive.